Legends
Types of legends Muze supports
Muze provides ability to encode your information into different color, shape or size . Like different categorial values can be broken into multiple colors or shape where as a quantitative value can be encoded into different size ranges.
Muze supports following types of legend :
- Discrete Legends
- Color Legend
- Shape Legend
- Size Legend
- Continuous Legends
- Gradient Legend
- Step Legend
Adding simple text content
Adding legends to your chart
You can add legends using color, shape and size api of muze.
Let's see how you can create each of these legends in muze.
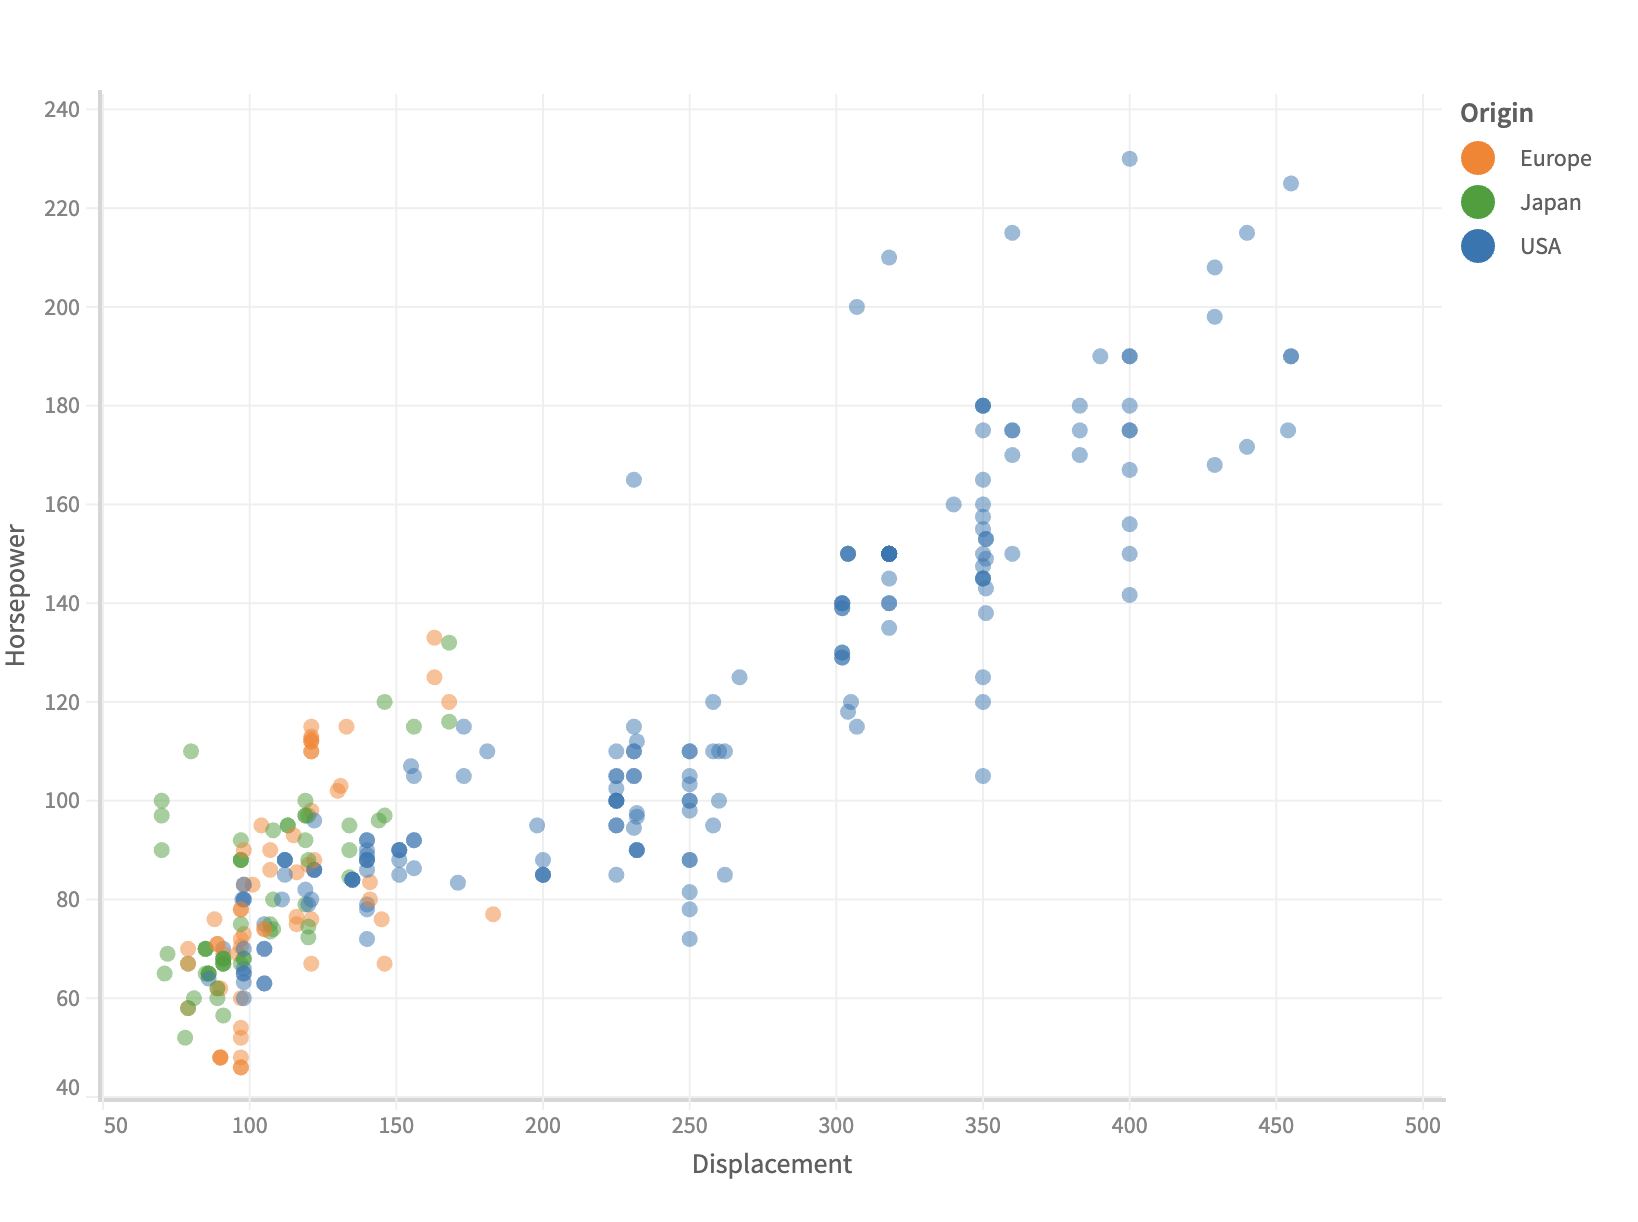
Color Legend
Color Legends can be used to show both categorical data and quantitative values.
If fieldName is dimension , then a discrete legend is created.
Here is how you can create a discrete color legend in muze:
...
  .color('Origin')
...
const { muze, getDataFromSearchQuery, env } = viz;
const data = getDataFromSearchQuery();

muze
  .canvas()
  .data(data)
  .rows(["Horsepower"])
  .columns(["Displacement"])
  .color("Origin")
  .detail(["Name"])
  .mount("#chart");
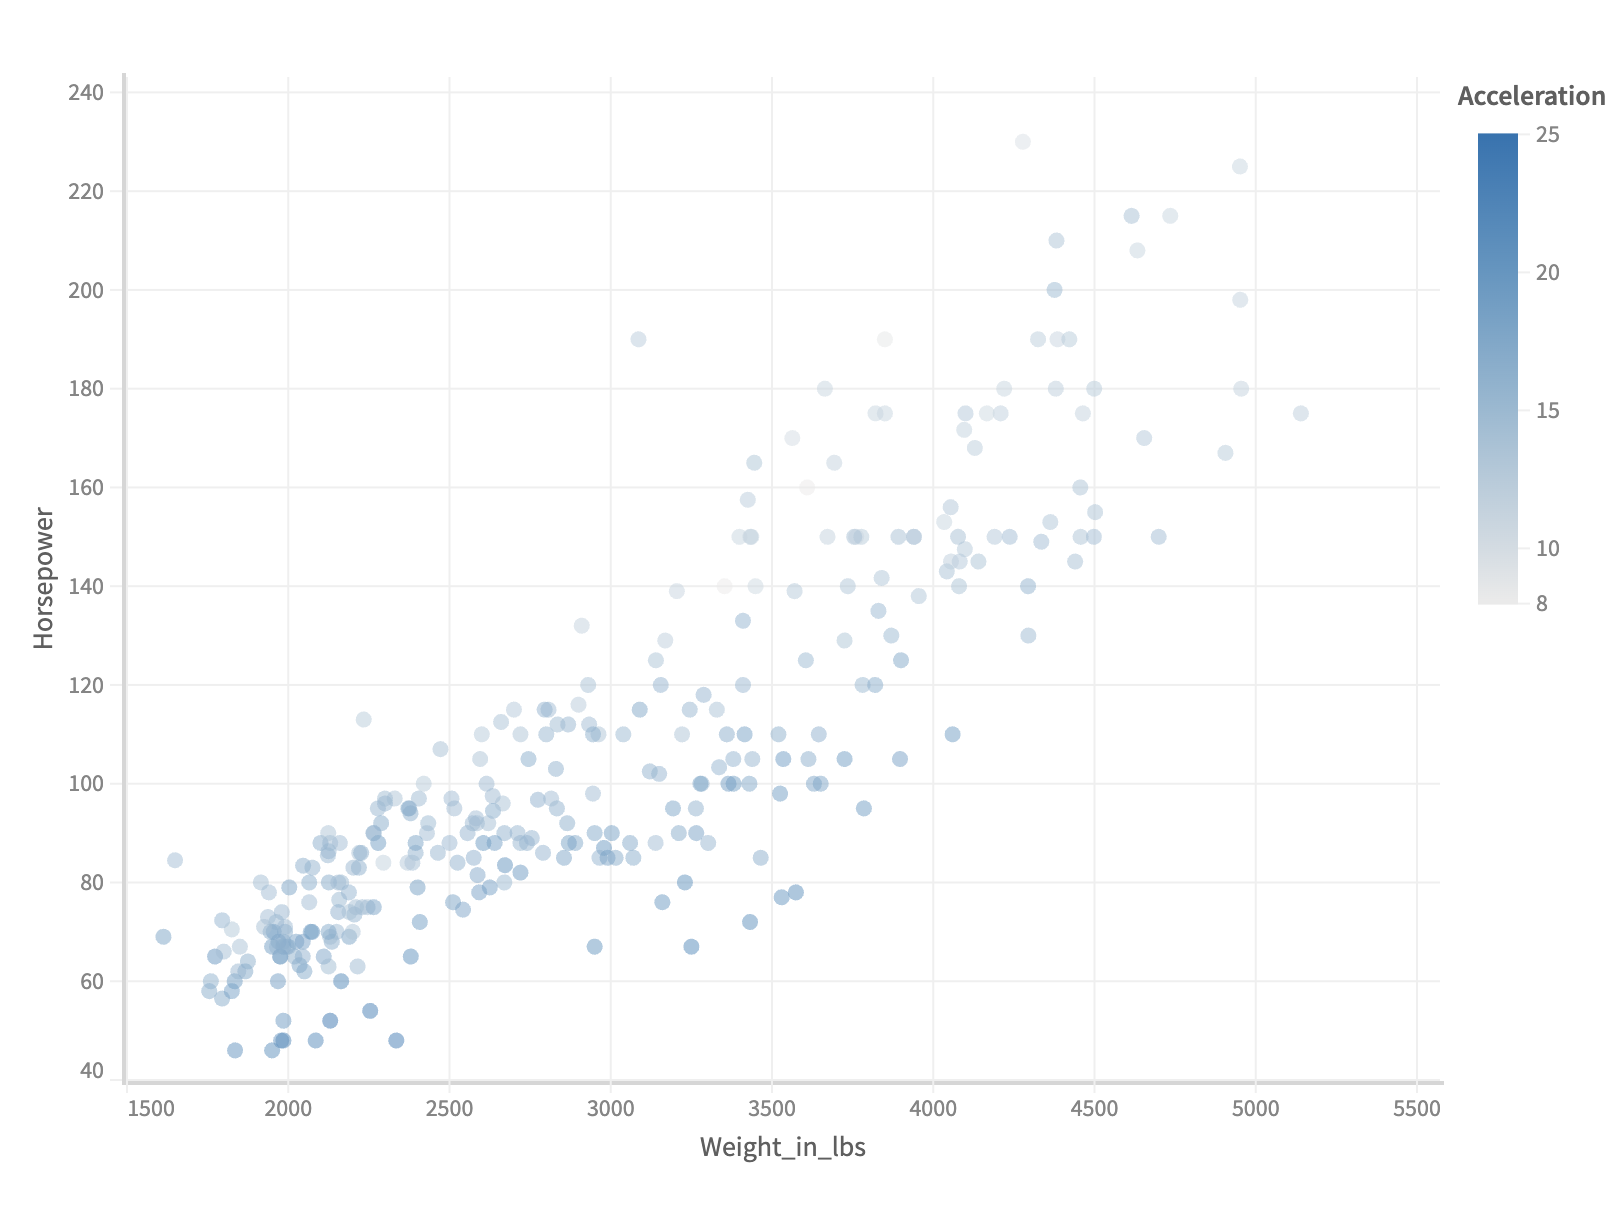
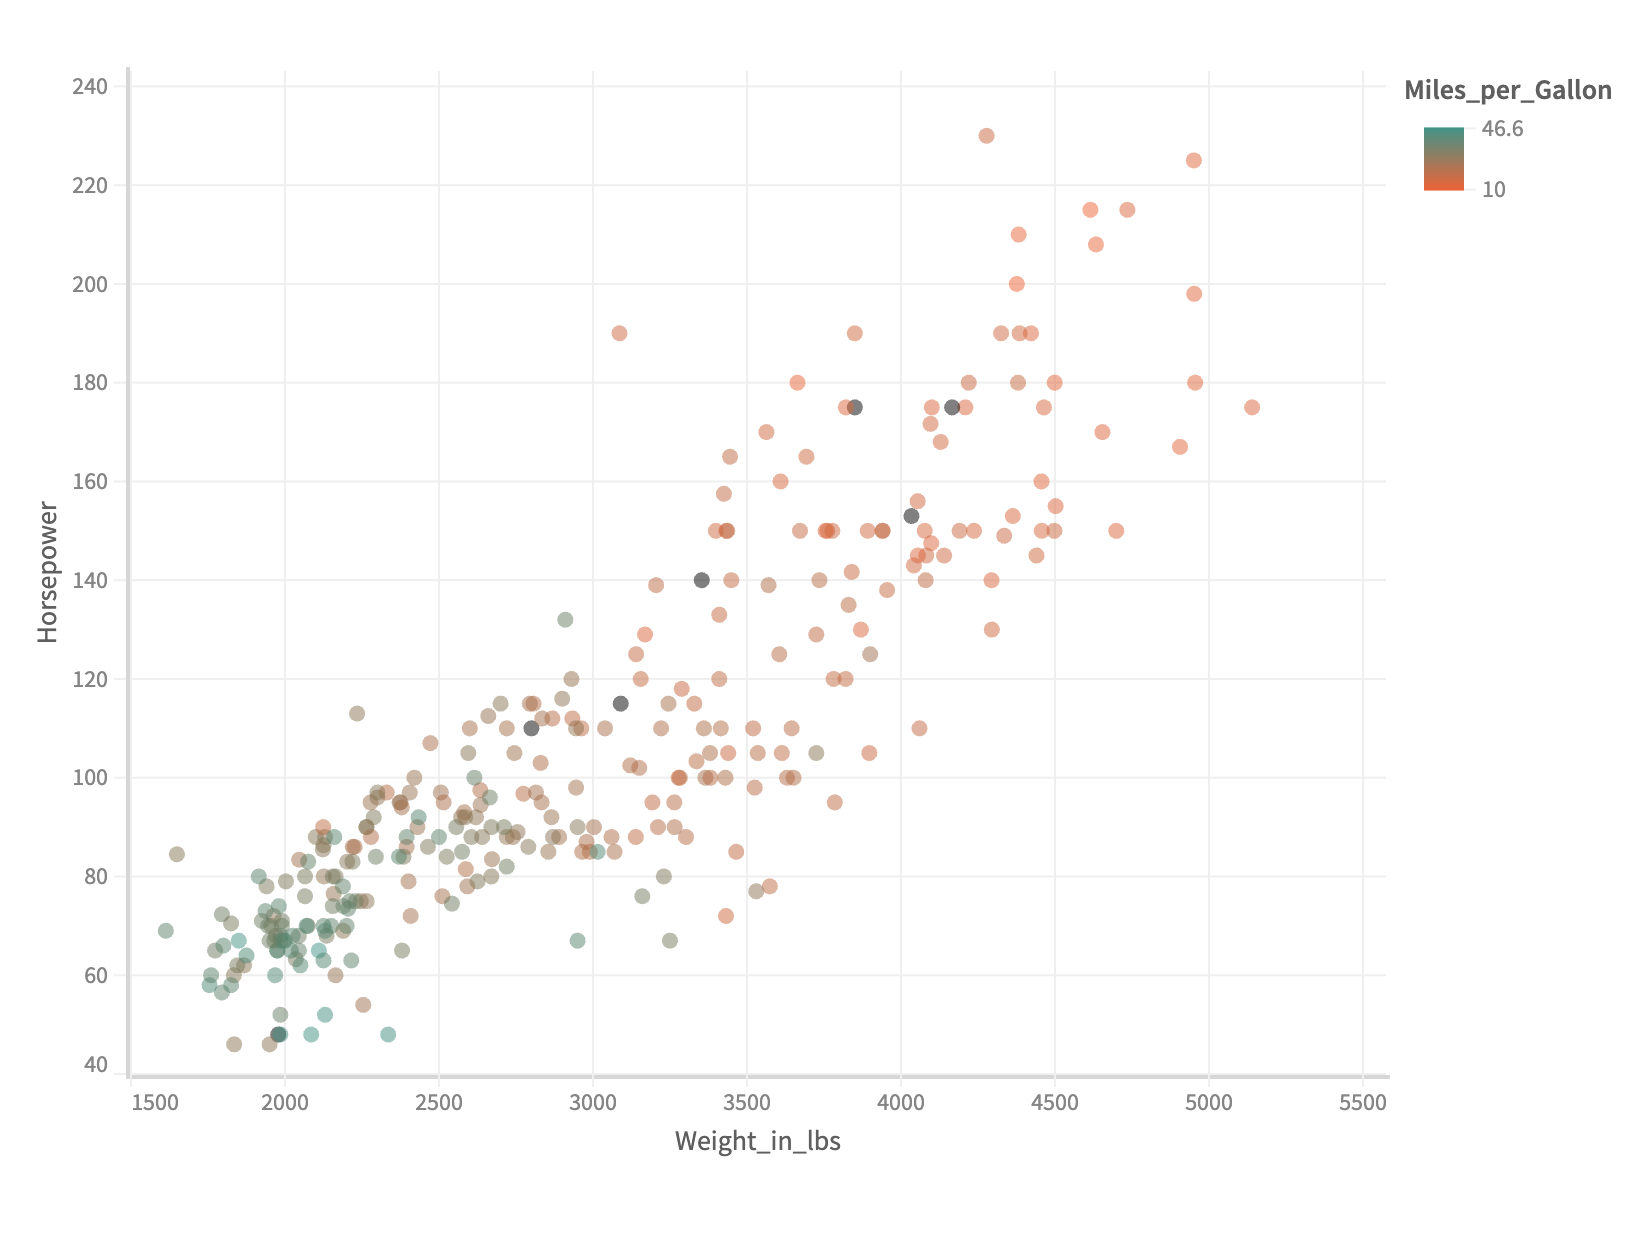
Gradient Legend
If fieldName is measure, then a gradient legend is created.
...
    .color('Miles_per_Gallon')
...
const { muze, getDataFromSearchQuery, env } = viz;
const data = getDataFromSearchQuery();

muze
  .canvas()
  .data(data)
  .rows(["Horsepower"])
  .columns(["Weight_in_lbs"])
  .color("Acceleration")
  .detail(["Name"])
  .mount("#chart");
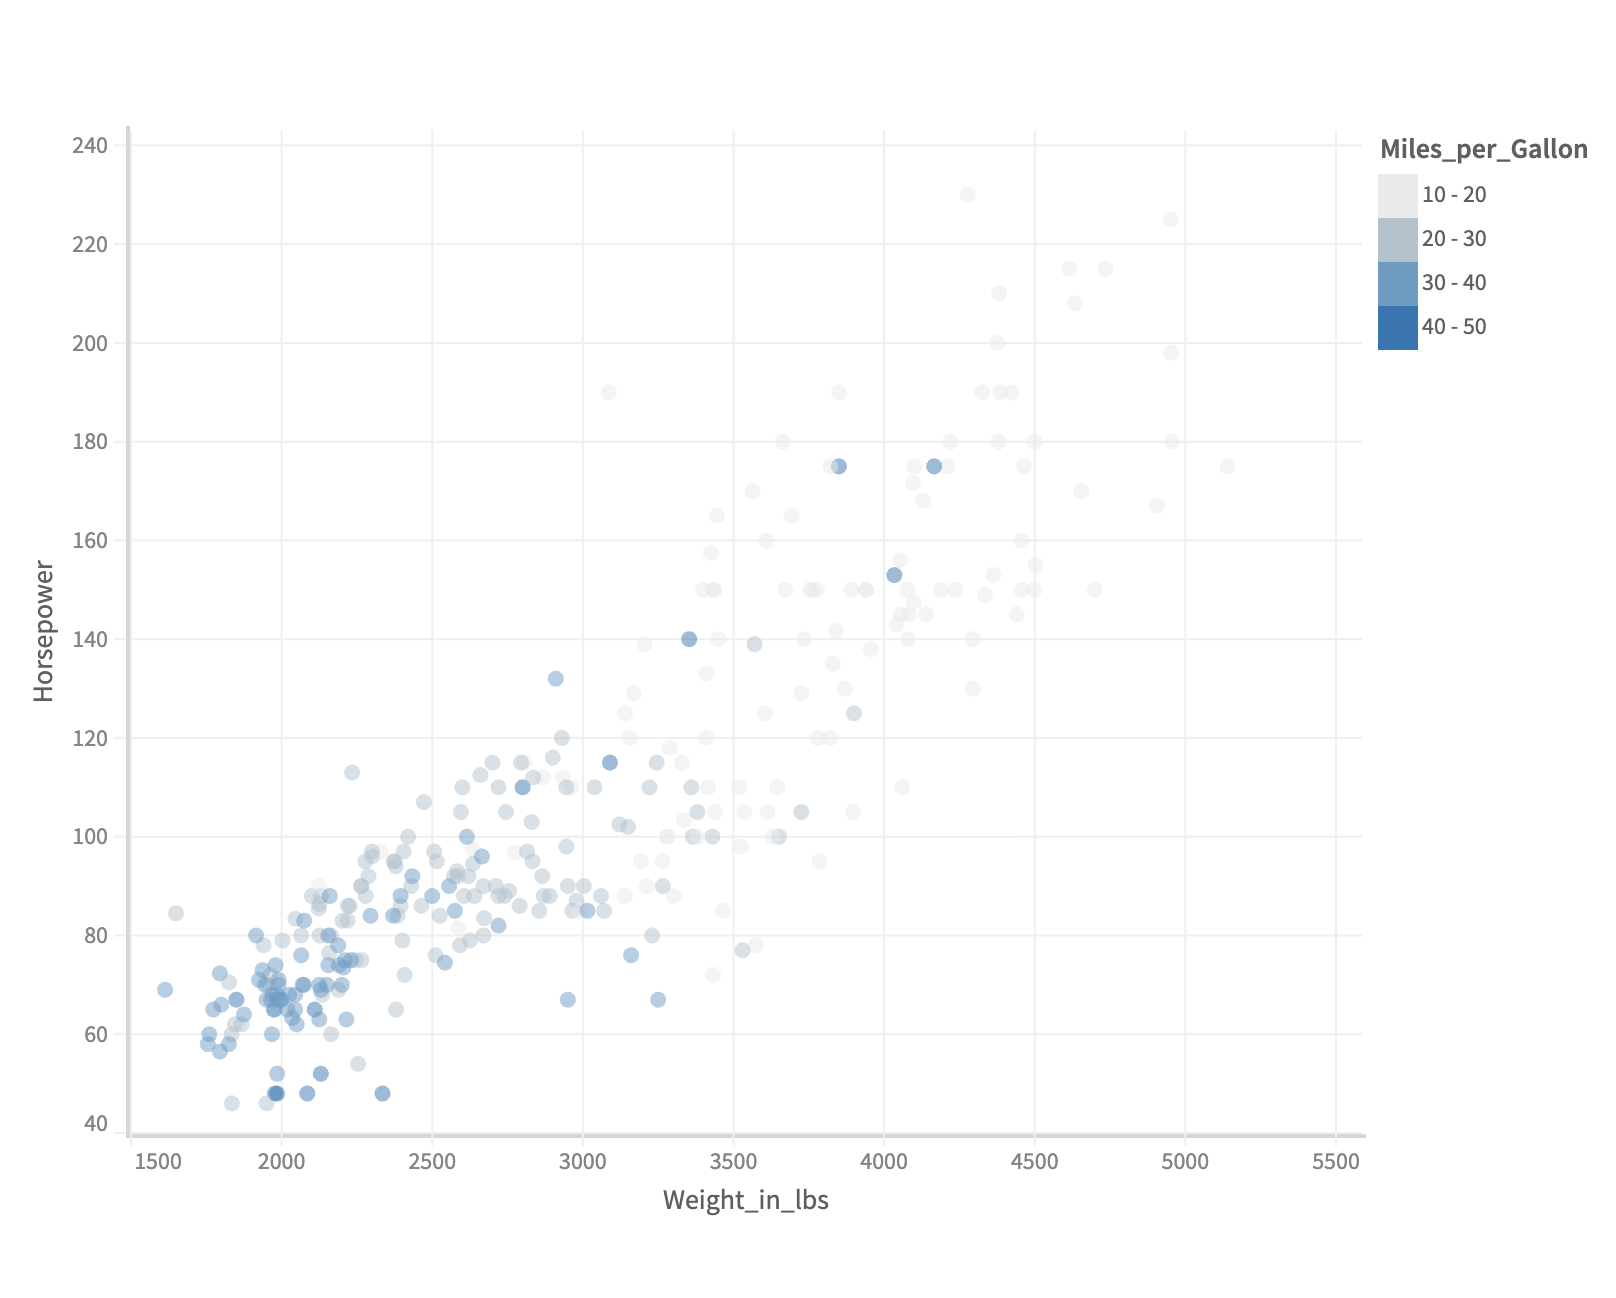
Step Legend
Step legends can be created by setting step to true in color api.
Here is how you can create a step legend,
...
  .color({
     field: 'Miles_per_Gallon',
     step: true
  })
...
const { muze, getDataFromSearchQuery, env } = viz;
const data = getDataFromSearchQuery();

muze
  .canvas()
  .data(data)
  .rows(["Horsepower"])
  .columns(["Weight_in_lbs"])
  .detail(["Name"])
  .color({
    field: "Miles_per_Gallon",
    step: true,
  })
  .mount("#chart");
Customizing number of stops and color
For a gradient legend, you can provide number stops you want in your legend by providing the same in stops attribute, also it accepts an array of integers if you want specify custom stops. Also, you can specify the color for the stops in range attribute.
...
  .color({
    field : 'Horsepower',
    stops : 3,
    range: ['#ff5722', '#009688']
  })
...
const { muze, getDataFromSearchQuery, env } = viz;
const data = getDataFromSearchQuery();

muze
  .canvas()
  .data(data)
  .rows(["Horsepower"])
  .columns(["Weight_in_lbs"])
  .color({
    field: "Miles_per_Gallon",
    stops: 3,
    range: ["#ff5722", "#009688"],
  })
  .detail(["Name"])
  .mount("#chart");
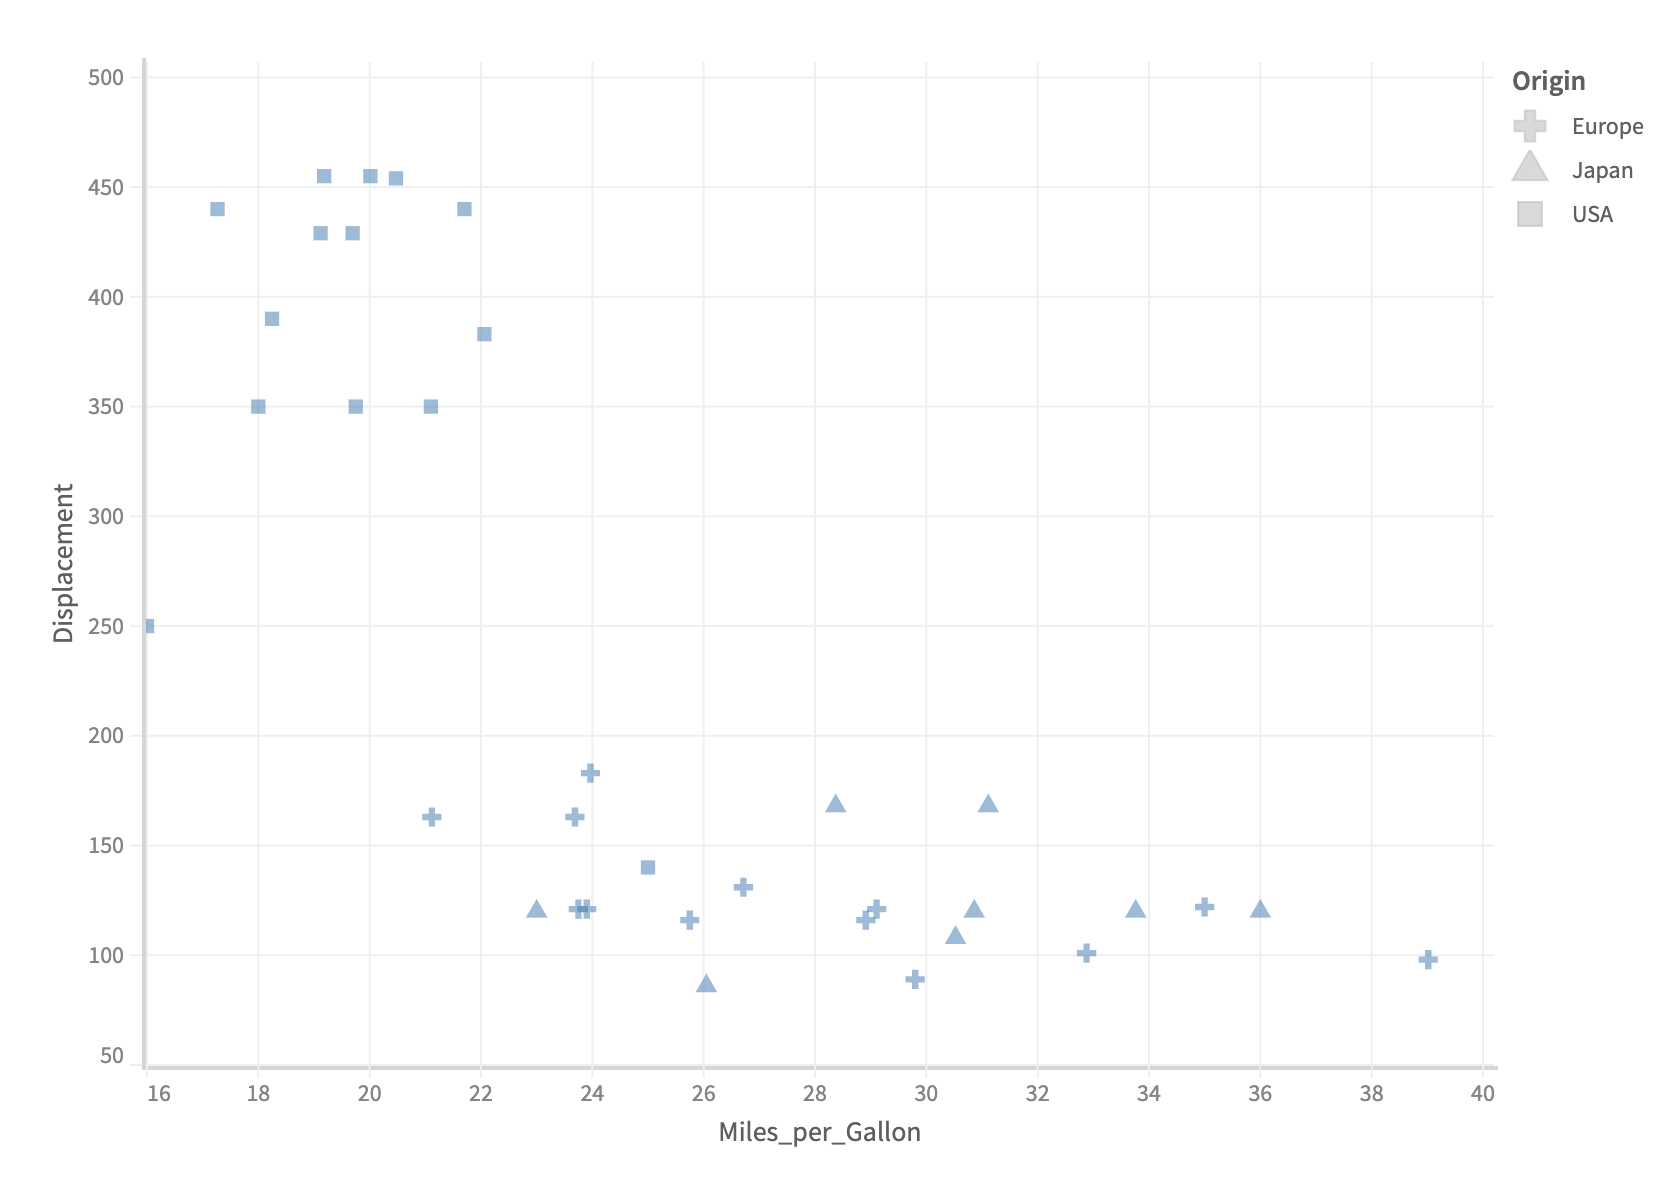
Shape Legend
Just like color encoding, you can assign a variable to shape encoding channel. The data points take different shape based on the value of variables assigned in the shape encoding channel.
...
  .rows(["Displacement"])
  .columns(["Miles_per_Gallon"])
  .shape("Origin")
  .detail(["Maker"])
...
const { muze, getDataFromSearchQuery, env } = viz;
const data = getDataFromSearchQuery();

muze
  .canvas()
  .data(data)
  .rows(["Displacement"])
  .columns(["Miles_per_Gallon"])
  .shape({
    field: "Origin",
    range: ["square", "cross", "triangle"],
  })
  .detail(["Maker"])
  .mount("#chart");
Size Legend
When we talk about size, intuitively, it refers to the dimensions a point occupies in a particular space, which for a 2d-space is its area. Thus, size is a reference to how the chart renders the areas of the points based on the values of field assigned in size encoding.
For example, a variable having values like 30, 50 and 70, will have three points having three different sizes with 70 being the largest and 30 being the smallest.
We'll see how this works for our data.
Let's say, we want our same Horsepower to Weight_in_lbs distribution but with it, we would like to see how Cylinders affect the visualization.
...
  .rows(['Weight_in_lbs'])
  .columns(['Horsepower'])
  .detail(['Name'])
  .size('Cylinders')
...
const { muze, getDataFromSearchQuery, env } = viz;
const data = getDataFromSearchQuery();

muze
  .canvas()
  .data(data)
  .rows(["Weight_in_lbs"])
  .columns(["Horsepower"])
  .detail(["Name"])
  .size("Cylinders")
  .mount("#chart");
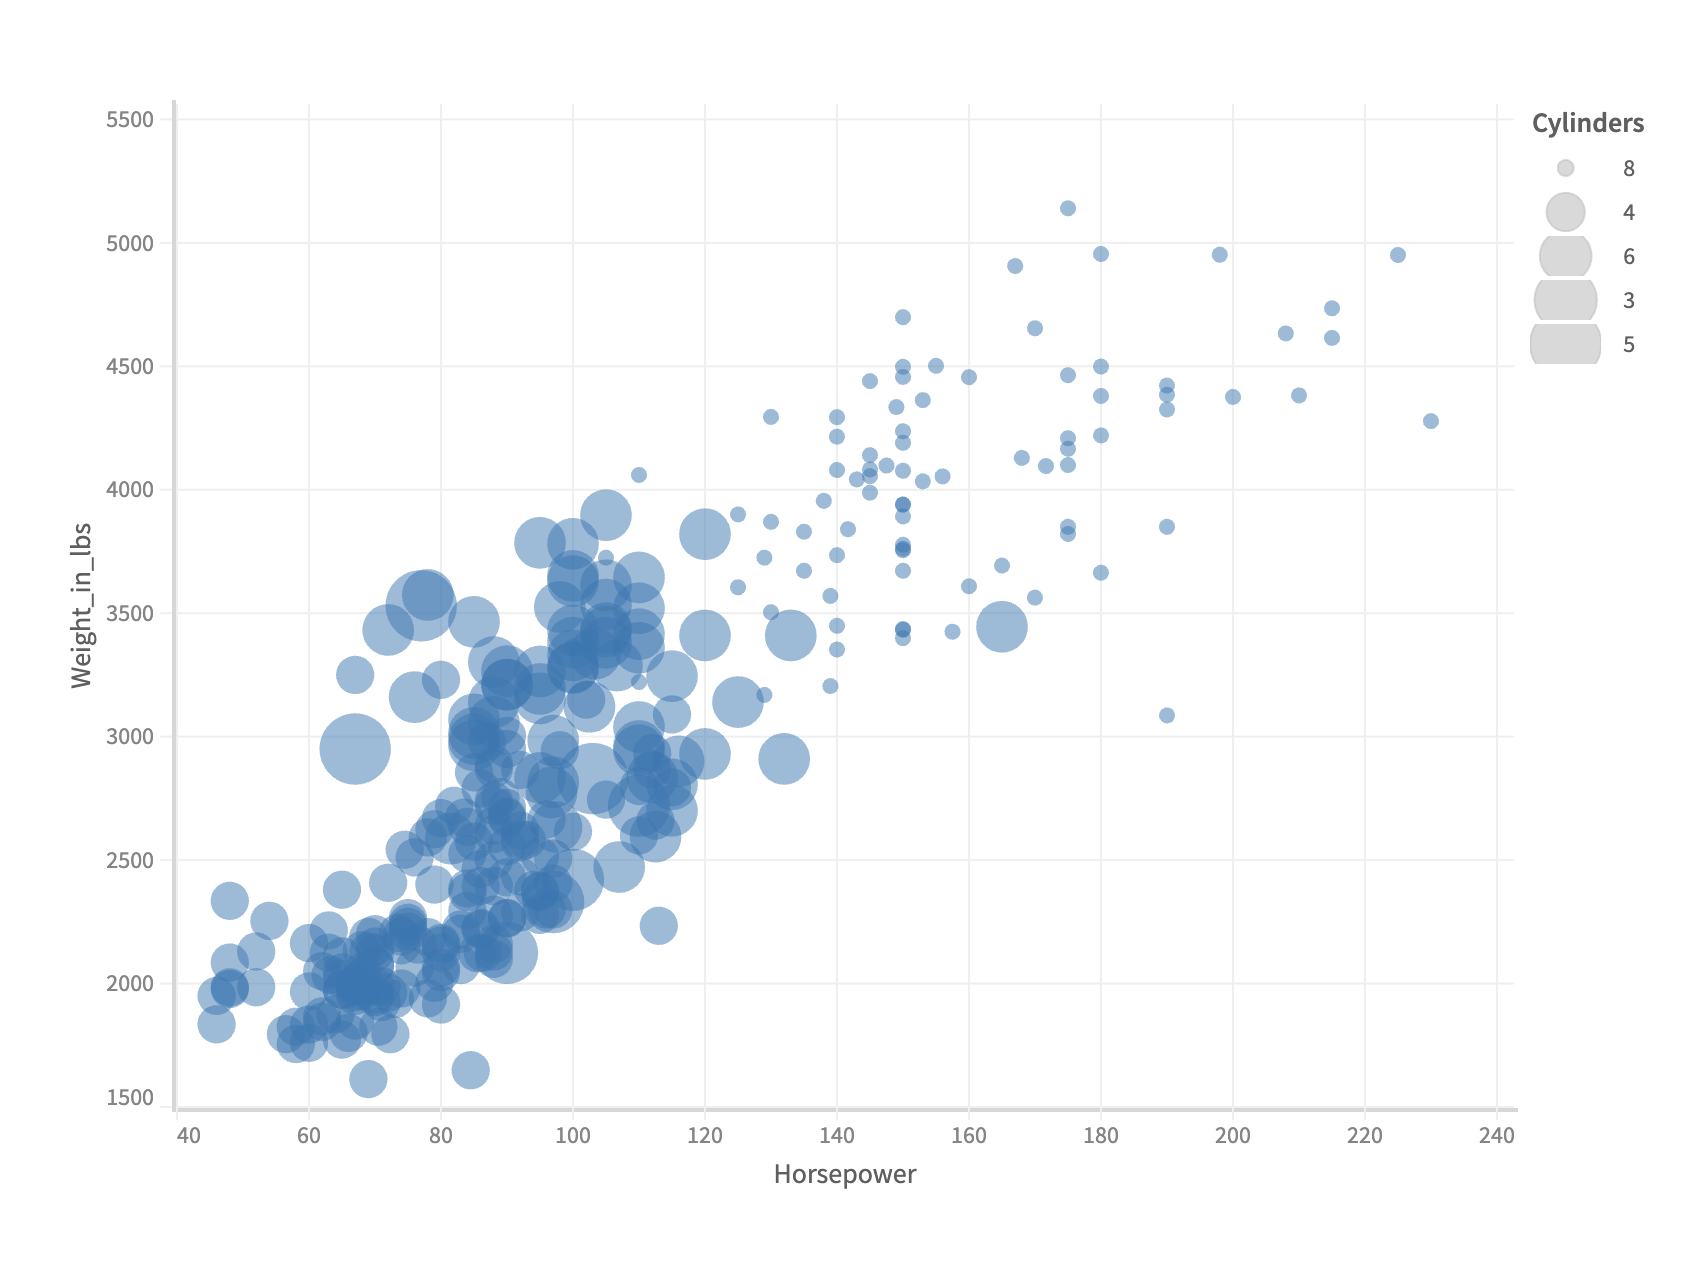
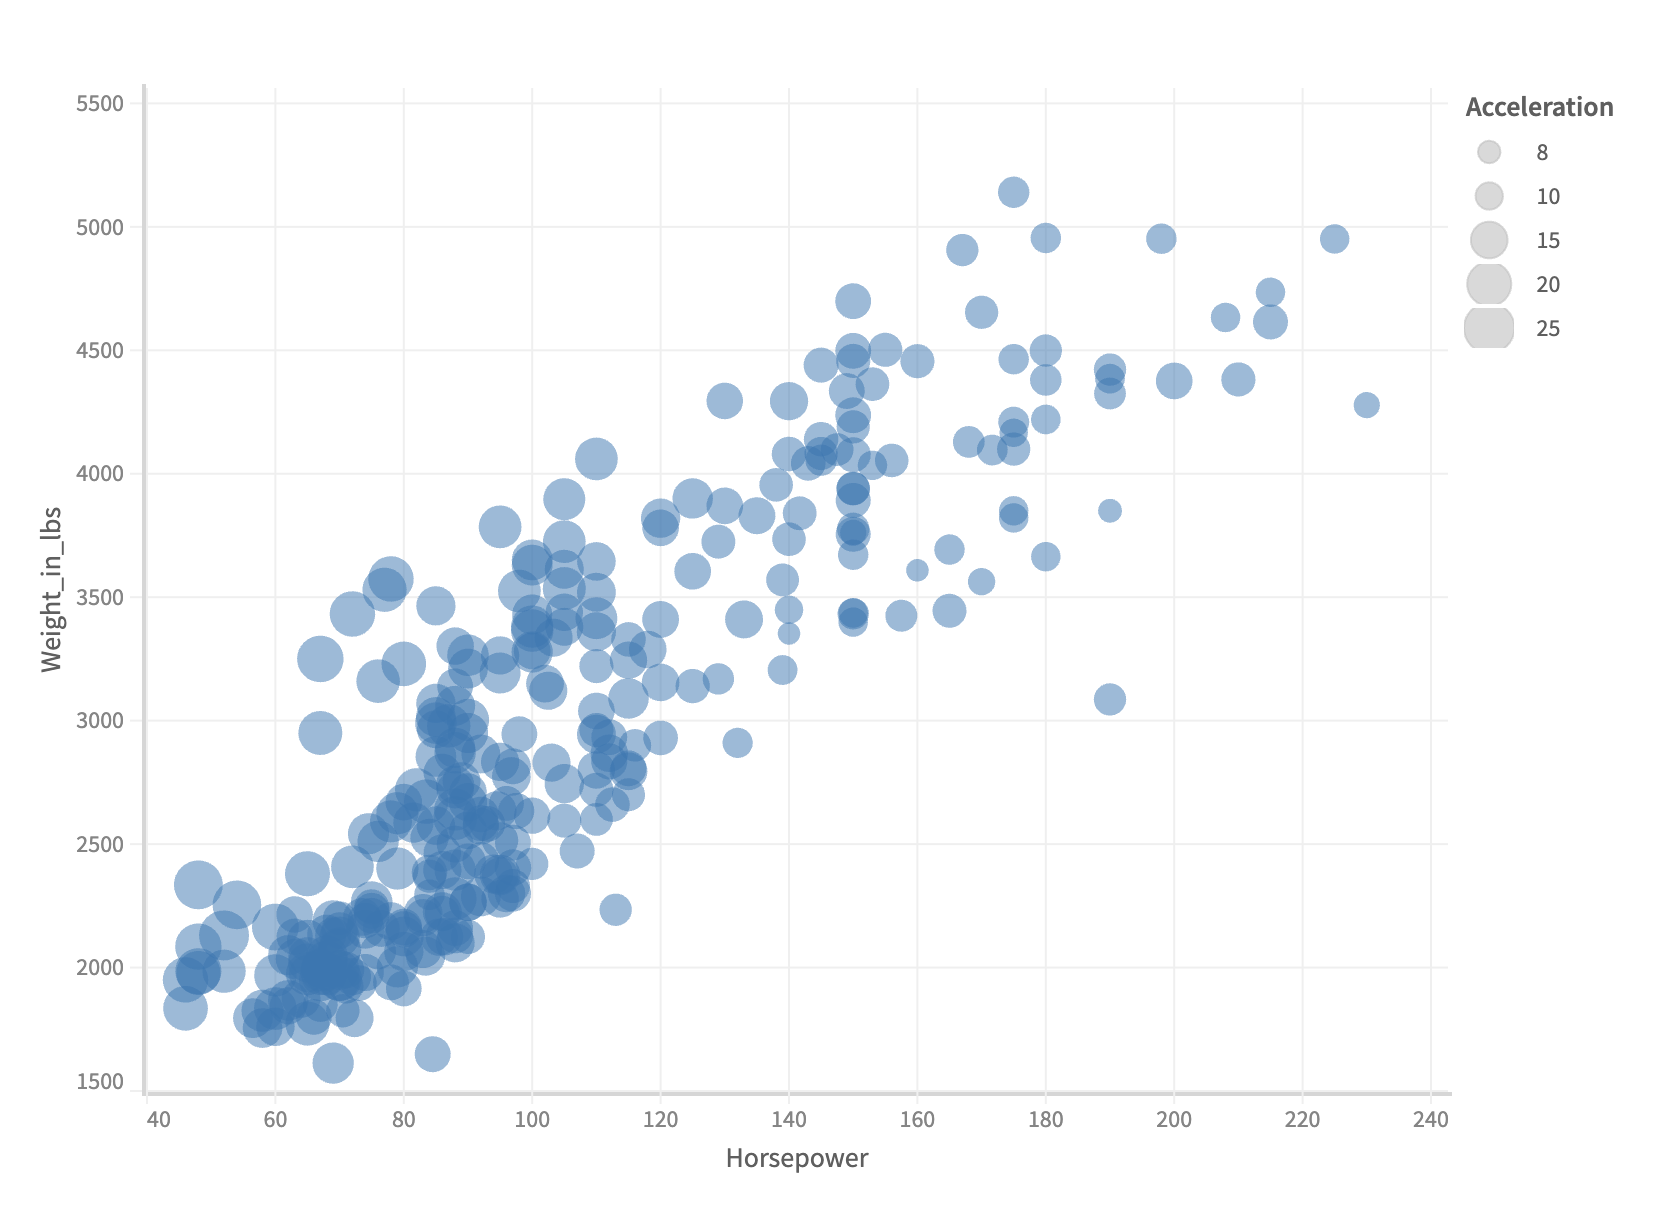
Notice, how the points change their sizes based on the values of Cylinders associated with it. You can also assign a measure field to the size encoding channel.
By default the limit of the sizes are taken from Muze's internal config. You can change the range of the size by mentioning the range configuration. Checkout the following example which shows custom range definition with a measure assigned to shape encoding channel.
...
  .rows(['Weight_in_lbs'])
  .columns(['Horsepower'])
  .detail(['Name'])
  .size({
    field: 'Acceleration',
    range: [100, 500]
  })
...
const { muze, getDataFromSearchQuery, env } = viz;
const data = getDataFromSearchQuery();

muze
  .canvas()
  .data(data)
  .rows(["Weight_in_lbs"])
  .columns(["Horsepower"])
  .detail(["Name"])
  .size({
    field: "Acceleration",
    range: [100, 500],
  })
  .mount("#chart");
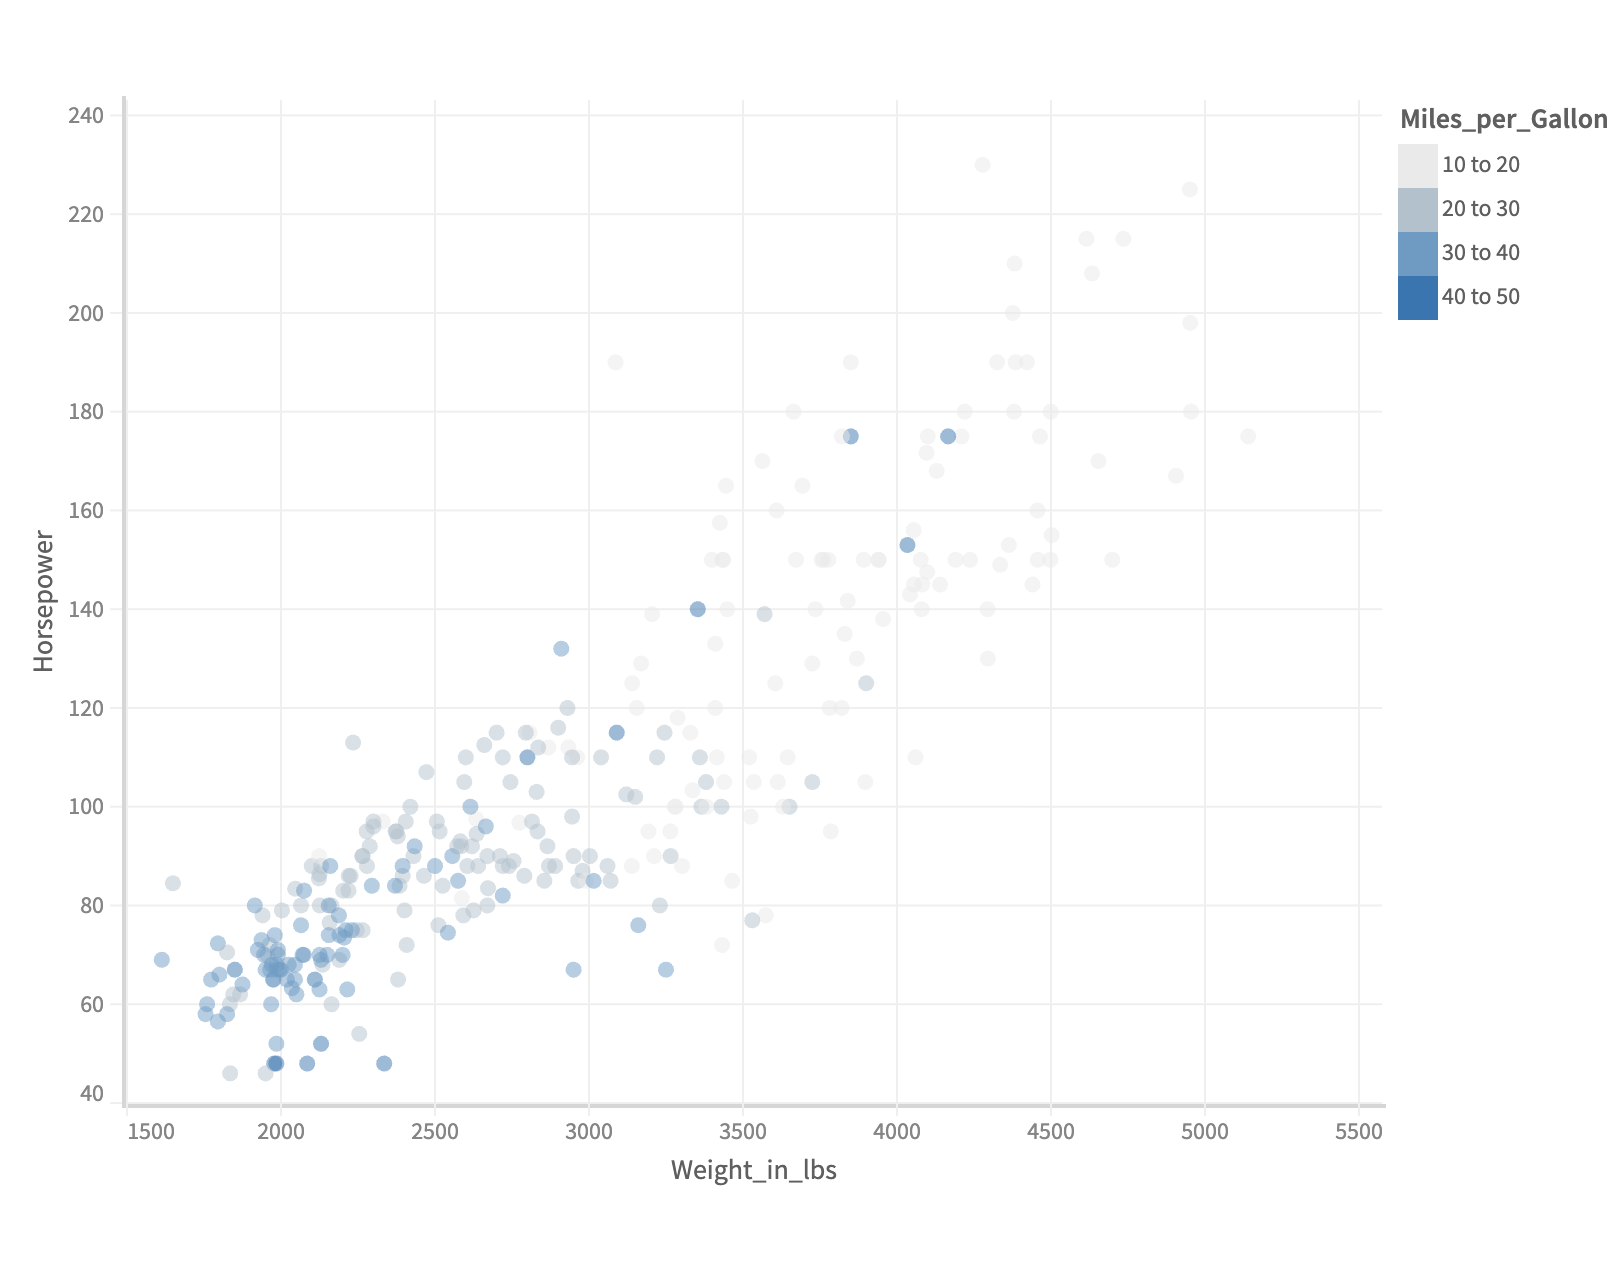
Formatting the legend
The labels of a step legend can be formatted using formatter function in legend configuration.
Let's see how you can do that in muze,
...
   .config({
      legend: {
        color: {
          item: {
            text: {
              formatter: (val, domain, dm) => {
                return val.join(' to ');
              }
            }
          }
        }
      }
    })
...
const { muze, getDataFromSearchQuery, env } = viz;
const data = getDataFromSearchQuery();

muze
  .canvas()
  .data(data)
  .rows(["Horsepower"])
  .columns(["Weight_in_lbs"])
  .detail(["Name"])
  .color({
    field: "Miles_per_Gallon",
    step: true,
    stops: 5,
  })
  .config({
    legend: {
      color: {
        item: {
          text: {
            formatter: (val, index, dm) => {
              return val.join(" to ");
            },
          },
        },
      },
    },
  })
  .mount("#chart");
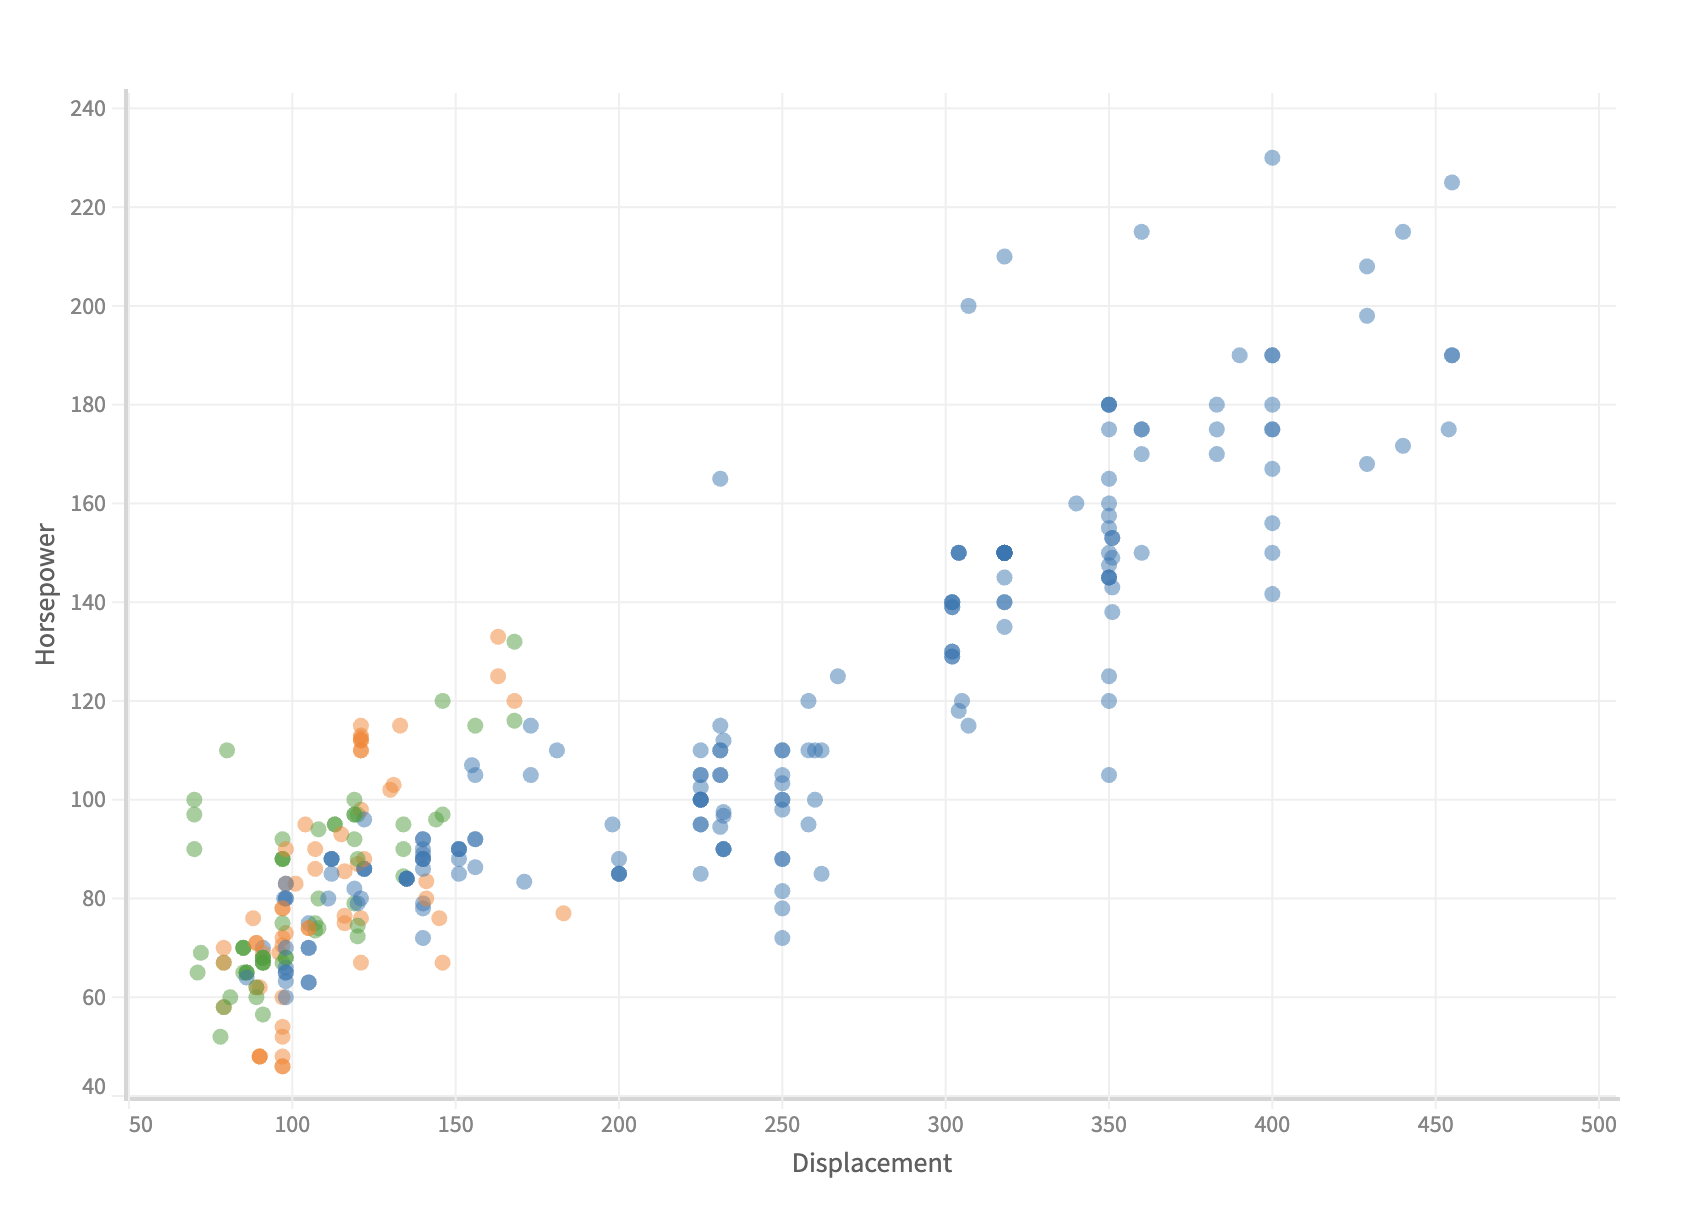
You can also hide a legend using show attribute in legend configuration:
...
    .config({
        legend: {
          color: {
            show: false
          }
        }
    })
...
Setting show to false in color object only hides the color legend. This is useful if you have color, shape and size legend in your chart and you want to hide only one legend.
const { muze, getDataFromSearchQuery, env } = viz;
const data = getDataFromSearchQuery();

muze
  .canvas()
  .data(data)
  .config({
    legend: {
      color: {
        show: false,
      },
    },
  })
  .rows(["Horsepower"])
  .columns(["Displacement"])
  .color("Origin")
  .detail(["Name"])
  .mount("#chart");