Use Muze Studio in Thoughtspot
Muze Studio is currently in Early Access (EA) in version 10.15.0
You can now create your own charts inside ThoughtSpot using Muze Studio. With Muze studio, you can use the Muze library to create a chart in any Answer. Muze is a charting library that supports a lot of different chart types and customizations. For information about Muze, see Introduction to Muze.
If you're a developer, you can use the code editor to create a new chart type in an Answer by writing the code. Using the chart library API, you can create complex charts with very few lines of code. Though the chart is available only to an individual Answer, other users can make a copy of the Answer and modify it to reuse the same chart type.
You also can use any of the available charts in the Muze chart library. For more information, see Muze chart gallery. To enable this feature, contact your ThoughtSpot administrator. If you're an administrator, see Enabling Muze Studio.
The code editor comprises three components:
- The JavaScript editor, where you can use the API to render complex charts.
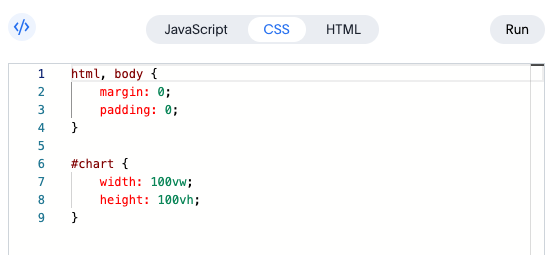
- The CSS editor, where you create your chart's look and feel by applying different styles using available classes in CSS.
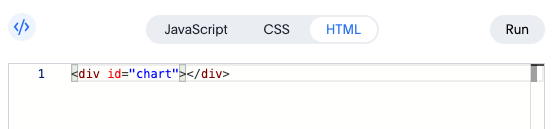
- The HTML editor, where you can add the chart container, structure the layout, and add additional elements like annotation.
As you make changes to a chart, you can click the Run button to see the results of your changes in the chart preview pane to the left.
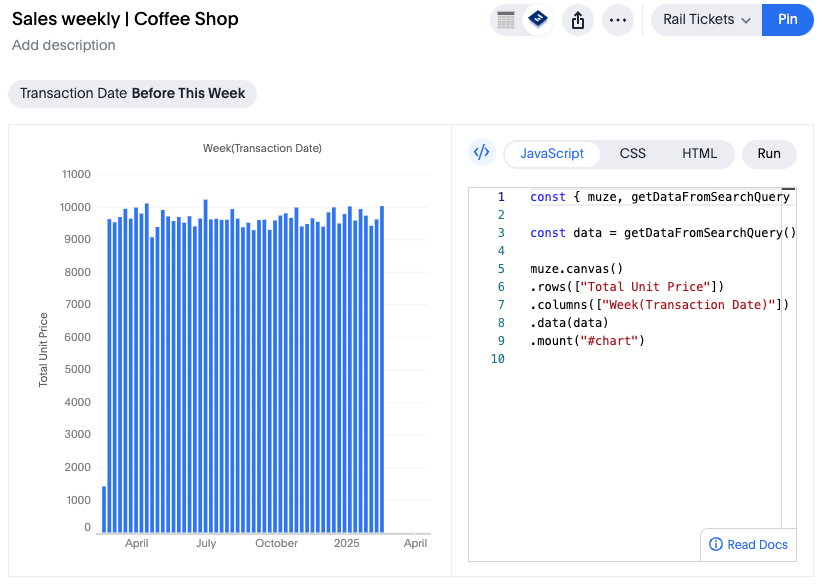
JavaScript editor
The following APIs and data are available in the JavaScript editor:
- Muze library: contains the exhaustive API to create different kinds of charts, composing multiple layers in the same chart, cross-interaction in multiple canvases, and more.
- Data and DataModel: The data coming from a Sage search query is available in the editor. Muze also provides an in-memory data-manipulation component called DataModel which you can use to add filters, selection, group-by, and more, allowing you to structure the data to render very specific charts.
- Color palettes: The color that is used at the global level of the entire application uses the color API, so that you can use it in your chart to match the color and styles used in other chart types. By default, it uses the cluster-wide color palette that is defined by the customer just like other charts.
- Measure Names and Measure Values: Use these virtual columns to create multi-measure visualizations like pivot tables by transforming multiple measures into a single dimension-measure pair.
- Formatters: Provides NumberFormatter for currency, decimal, and percentage values with auto-scaling (K, M, B) support, DateFormatter for flexible date and time formatting, and SplitByFormatter for applying different formatters to different categories in your data.
- Conditional Formatting: Dynamically change colors of chart elements based on data values using conditional functions in the color encoding to highlight thresholds, performance levels, or category-based distinctions.
- Operators: Provides utility operators including
share()for creating composed variables from multiple fields andhtmlfor sanitizing HTML strings in titles and tooltips.
For more information about the Muze API, see: Muze API reference.
CSS editor
In the CSS editor, you can style the container for your chart.
For details on how you can style your chart, see Styling your charts in the Muze documentation.
HTML editor
In the HTML editor, you add a container element for your chart. If you need multiple charts, you can add additional container elements. The <div> tags define the container where the visualization appears.
Getting started
To create a native chart using Muze Studio, do the following:
- Create an Answer or open an existing one.
- Click the Change visualization button
 .
. - In the Custom section at the bottom of the Chart panel, click Muze Studio.
- A bar chart appears, by default.
- In the upper-right corner of the chart preview pane, click the code editor button
 .
. - The code editor panel opens, with the JavaScript tab selected and the default code for the chart.
- Make any changes you want to the existing code, or use code for any of the charts in the Muze chart library.
- As you make changes, click the Run button to see the changes to your chart in the preview pane.
- After you finish, click the Save button to save your chart. If your answer is already pinned to a Liveboard, you can click the Pin button, to publish your changes to the Liveboard.
Enabling Muze Studio
If you are a ThoughtSpot administrator, you can enable Muze Studio by doing the following:
-
Navigate to Admin Settings
Open the cluster and go to the Admin Settings page.
-
Open the "All Orgs" Tab
On the left-hand side panel, switch to the All Orgs tab to view organization-level configurations.
-
Access Early Access Features
Under the APPLICATION SETTINGS section, click on Early access features. This section contains experimental or upcoming features that can be toggled for your organization.
-
Edit the Settings
On the Early Access Features page, click on the Edit button to make changes.
-
Enable Muze Studio
Find the option labeled Build your own charts with Muze Studio, and turn it on to enable it.
-
Save Your Changes
After enabling the feature, click Save to apply your settings.
-
Verify the Feature
Now, the Muze Studio should appear in the chart list when creating an answer.
To run Muze Studio in ThoughtSpot, customers must whitelist some URLs.
- ThoughtSpot Embedded (TSE) users can whitelist the domain by following the steps listed below.
- ThoughtSpot Analytics (TSA) users should contact support for assistance with the whitelisting of the domain.
- Go to Developer, then click Security settings.
- Click Edit, and enter the following:
- For Permitted iFrame domains, enter:
*.pdom.thoughtspot.com
- For Permitted iFrame domains, enter:
- Click Save Changes.
Muze Studio is now available on your ThoughtSpot cluster.