Integrate Conditional Formatting
With TS-Chart-SDK, you can easily integrate the conditional formatting configurator provided by ThoughtSpot at the column-level settings. Currently, for conditional formatting in custom charts, we provide support for measure values and attributes if they are of a numeric type.
NOTE: While integrating conditional formatting for your chart, the axis config with key values as 'x' and 'y' will be considered for conditional formatting.
Steps to Enable Conditional Formatting
To enable conditional formatting with TS-Chart-SDK, perform the following steps:
Step 1: Allow Conditional Formatting
Enable conditional formatting in your allowedConfiguration.
const ctx = await getChartContext({
  // initialize other params
  allowedConfiguration: {
    conditionalFormatting: true,
  },
  // initialize other params
});
Step 2: Access Conditional Formatting Config
After enabling, you will get the conditionalFormattingConfig in the chartModel for the x and y axis config column IDs. Utilizing this cfConfig, you can create plot lines and bands in your chart.
Step 3: Implement Data Model Function
Implement the following function in your dataModel to utilize conditional formatting:
function getColumnDataModel(
  configDimensions, // you can config dimension using chartModel.config?.chartConfig?.[0].dimensions
  dataArr: DataPointsArray,
  type,
  visualProps: VisualProps,
  customStyleConfig: ChartSdkCustomStylingConfig
) {
  const xAxisColumns = configDimensions?.[0].columns ?? [];
  const yAxisColumns = configDimensions?.[1].columns ?? [];

  return {
    getDatasets: () =>
      _.map(yAxisColumns, (col, idx) => {
        const coldata = getDataForColumn(col, dataArr);
        const CFforColumn = getCfForColumn(col);
        const axisId = `${type}-y${idx.toString()}`;
        const { plotlines, plotbands } =
          getPlotLinesAndBandsFromConditionalFormatting(CFforColumn, axisId);

        return {
          plotlines,
          plotbands,
        };
      }),
    // other function in getColumnDataModel
  };
}
Here, getCfForColumn is a utility function to get the conditionalFormattingConfig for the column provided by TS-Chart-SDK.
Step 4: Define Plot Lines and Bands
Define getPlotLinesAndBandsFromConditionalFormatting in your custom-chart-utils.ts. This is customized for the chart library you are using. It demonstrates how you can use the conditionalFormattingConfig to create plot lines and bands.
import {
  ChartSdkCustomStylingConfig,
  ConditionalFormatting,
  Operators,
  VisualProps,
} from "@thoughtspot/ts-chart-sdk";

export function getPlotLinesAndBandsFromConditionalFormatting(
  CFforColumn: ConditionalFormatting | undefined,
  axisId: string
) {
  const plotlines: any = [];
  const plotbands: any = [];

  CFforColumn?.rows?.forEach((metric) => {
    const value = metric?.value ? parseFloat(metric.value) : null;
    const color = metric?.solidBackgroundAttrs?.color;

    if (metric?.operator === Operators.IsBetween) {
      const value1 = metric?.rangeValues?.min ?? null;
      const value2 = metric?.rangeValues?.max ?? null;
      if (value1 !== null && value2 !== null) {
        plotlines.push(
          {
            value: value1,
            axisId,
            color,
            fill: metric?.plotAsBand,
          },
          {
            value: value2,
            axisId,
            color,
            fill: metric?.plotAsBand,
          }
        );
        if (metric?.plotAsBand) {
          plotbands.push({
            from: value1,
            to: value2,
            axisId,
            color,
          });
        }
      }
    } else if (value !== null) {
      plotlines.push({
        value,
        axisId,
        color,
        fill: metric?.plotAsBand,
      });
    }
  });
  return { plotlines, plotbands };
}
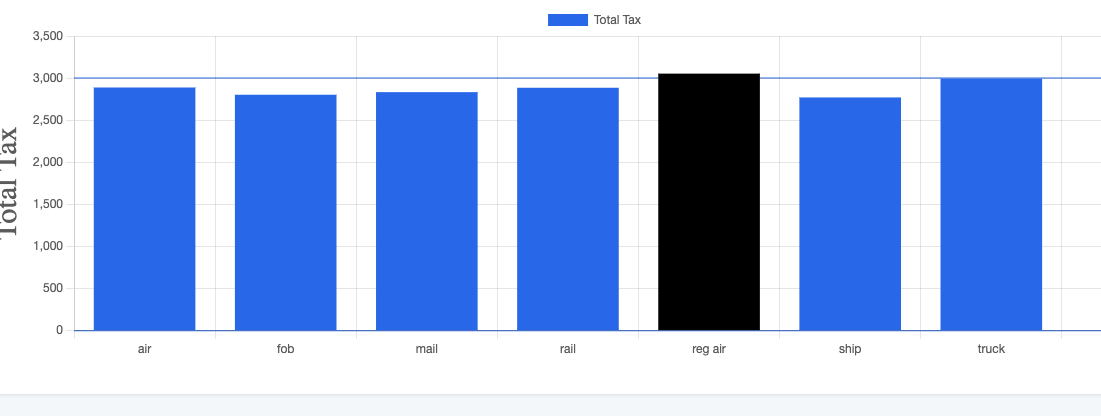
The conditional formatting config is shown below is with in between operator with min as 0 and max 3000.
Additional Information
As of now, you can have multiple conditional formatting configs for a column, so you need to decide which config you want to use to show plot lines and bands. Here, we are using the config with an "in-between" operator. Developers need to write logic based on the scenarios they are dealing with.
There are other utility functions for conditional formatting which can be seen in conditionalFormatting.ts. Please have a look at it.