Customize Tooltips
There are two ways to have a functional tooltip with the TS Chart SDK:
-
Defining it in your iframe: This is based on the custom chart context that we get from the SDK.
-
Using Events: You can use events known as
chartToTSEvent.ShowTooltipandchartToTSEvent.HideTooltip. These events utilize thePointerEvent, custom content if you want any to be shown in the tooltip, and a point which is the array object of the column ID and value corresponding to each column in the chart.
The first method is up to the developer, who can use any tool to create their own tooltip.
Using Events for Tooltips
Let's discuss the second method. Showing a tooltip with this will render a TS-made custom tooltip on the chart, which will be displayed there.
Let's say you want to show a tooltip with the x-axis and y-axis value at the current point.
First, prepare the point value that will go in the showTooltip event. You can create a function getPointDetails which will take xPos and yPos as parameters and return the point value. xPos and yPos can be obtained from the chart library you are using and by using the corresponding active element getter.
const getPointDetails = (xPos: number, yPos: number): PointVal[] => [
  {
    columnId: xAxisColumns[0].id,
    value: getDataForColumn(xAxisColumns[0], dataArr)[xPos],
  },
  {
    columnId: yAxisColumns[yPos].id,
    value: getDataForColumn(yAxisColumns[yPos], dataArr)[xPos],
  },
];
To get data, you can use the getDataForColumn function, which will take the column and dataArr as parameters and return the data for the column.
const getDataForColumn = (column: ChartColumn, dataArr: DataPointsArray) => {
  const idx = _.findIndex(dataArr.columns, (colId) => column.id === colId);
  return _.map(dataArr.dataValue, (row) => row[idx]);
};
Now you can use these functionalities to create a hoverMouse handler in the following way.
const handleMouseOver = useCallback(
  (e: any) => {
    if (!e.chart) {
      return;
    }
    const elements = e.chart.getActiveElements(); // use your chart library's active element getter
    if (elements.length > 0) {
      const activeElement = elements[0];
      const dataX = activeElement?.index; // use your chart library's active element getter
      const dataY = activeElement?.datasetIndex; // use your chart library's active element getter
      if (!_.isNil(dataX) && !_.isNil(dataY)) {
        const point = getPointDetails(dataX, dataY);
        emitShowToolTip({
          event: getParsedEvent(e),
          point: {
            tuple: point,
          },
          customTooltipContent: [],
        });
      }
    } else {
      emitHideToolTip();
    }
  },
  [dataModel]
);
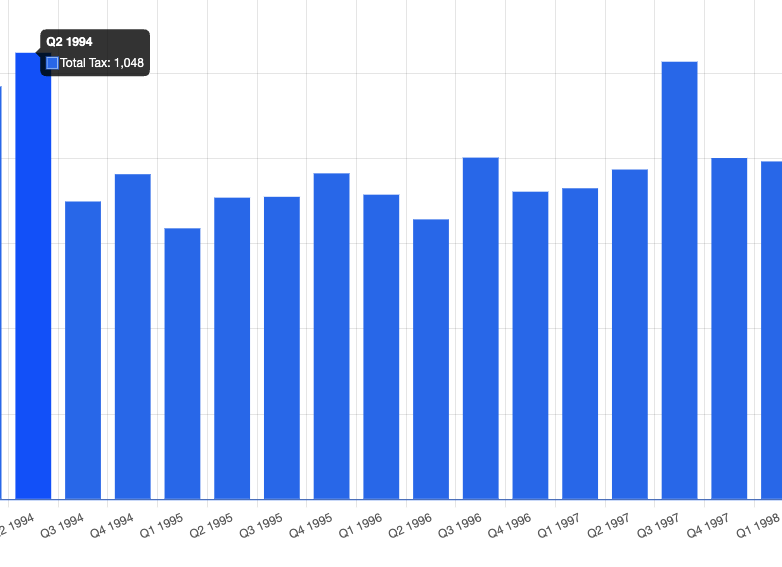
This will show your tooltip as depicted in the picture below.
You can also use NativeEditToolTip for TS tooltip customization to get more customization on your tooltip. To enable this, you need to define it in the return value for visualPropEditorDefiniton. Example:
{
  key: "tooltipconfig1",
  type: 'tooltipconfig',
  defaultValue: {
    columnIds: [],
  },
  label: 'ToolTip',
}