Composing multiple layers to make a custom plot type
What is a composite layer?
Composite layer is a layer which is constructed using two or more layers together. Once registered this can be used just like a normal layer (bar, point, etc.) is used. This allows reusability, define once use anywhere functionality with Muze.
Defining and registering a new composite layer
Layer instances are created internally by canvas using layerFactory.
layerFactory
Creates layer instances and registers composite layer definitions. Layer instances are created internally by canvas using layerFactory.
To access layerFactory:
const layerFactory = muze.layerFactory;
composeLayers
Registers composite layer definition in the layer factory:
composeLayers(layerName, definition);

// layerName - Name of the new layer
// definition - Configuration of the new layer
The definition we pass in to composeLayers is registered internally, which can then be used as a mark type in the layers configuration.
Adding the composite layer to a canvas
Below is an example using composite layers:
Example
const { muze } = viz;

const data = [
  {
    $SID: "discount",
    account_mgr: "Andy Bernard",
    region: "Midwest",
    discount: 18.52,
    quantity: null,
  },
  {
    $SID: "discount",
    account_mgr: "Andy Bernard",
    region: "Northeast",
    discount: 28.63,
    quantity: null,
  },
  {
    $SID: "discount",
    account_mgr: "Andy Bernard",
    region: "South",
    discount: 89,
    quantity: null,
  },
  {
    $SID: "discount",
    account_mgr: "Andy Bernard",
    region: "West",
    discount: 72.25,
    quantity: null,
  },
  {
    $SID: "discount",
    account_mgr: "Angela Martin",
    region: "Midwest",
    discount: 29.88,
    quantity: null,
  },
  {
    $SID: "discount",
    account_mgr: "Angela Martin",
    region: "Northeast",
    discount: 7.65,
    quantity: null,
  },
  {
    $SID: "discount",
    account_mgr: "Angela Martin",
    region: "South",
    discount: 42.25,
    quantity: null,
  },
  {
    $SID: "discount",
    account_mgr: "Angela Martin",
    region: "West",
    discount: 36.92,
    quantity: null,
  },
  {
    $SID: "discount",
    account_mgr: "Creed Patton",
    region: "Midwest",
    discount: 6.96,
    quantity: null,
  },
  {
    $SID: "discount",
    account_mgr: "Creed Patton",
    region: "Northeast",
    discount: 44.04,
    quantity: null,
  },
  {
    $SID: "discount",
    account_mgr: "Creed Patton",
    region: "South",
    discount: 37.58,
    quantity: null,
  },
  {
    $SID: "discount",
    account_mgr: "Creed Patton",
    region: "West",
    discount: 25.79,
    quantity: null,
  },
  {
    $SID: "quantity",
    account_mgr: "Andy Bernard",
    region: "Northeast",
    discount: null,
    quantity: 25,
  },
  {
    $SID: "quantity",
    account_mgr: "Angela Martin",
    region: "Northeast",
    discount: null,
    quantity: 65,
  },
  {
    $SID: "quantity",
    account_mgr: "Creed Patton",
    region: "Northeast",
    discount: null,
    quantity: 46,
  },
];

const schema = [
  {
    name: "$SID",
    type: "dimension",
    subtype: "categorical",
  },
  {
    name: "account_mgr",
    type: "dimension",
    subtype: "categorical",
  },
  {
    name: "region",
    type: "dimension",
    subtype: "categorical",
  },
  {
    name: "discount",
    type: "measure",
    subtype: "continuous",
  },
  {
    name: "quantity",
    type: "measure",
    subtype: "continuous",
  },
];

const formattedData =  muze.DataModel.loadDataSync(data, schema);
let dm = new muze.DataModel(formattedData);

const share = muze.Operators.share;
const layerFactory = muze.layerFactory;

const CompositeMarkName = "composedMark";
const DiscountField = "discount";
const QuantityField = "quantity";
const AccountManagerField = "account_mgr";
const RegionField = "region";
const SidField = "$SID";
const BarSourceName = "barSourceABC";
const LineSourceName = "lineSourceXYZ";
const Y0Encoding = "y0_foo";
const Y1Encoding = "y1_foo";

layerFactory.composeLayers(CompositeMarkName, [
  {
    mark: "bar",
    encoding: {
      y: `${CompositeMarkName}.encoding.${Y0Encoding}`,
      x: `${CompositeMarkName}.encoding.x`,
      color: `${CompositeMarkName}.encoding.color`,
    },
    transform: {
      type: "stack",
    },
    transition: {
      disabled: true,
    },
    source: `${CompositeMarkName}.${BarSourceName}`,
  },
  {
    mark: "line",
    encoding: {
      y: `${CompositeMarkName}.encoding.${Y1Encoding}`,
      x: `${CompositeMarkName}.encoding.x`,
    },
    transition: {
      disabled: true,
    },
    source: `${CompositeMarkName}.${LineSourceName}`,
  },
]);

muze
  .canvas()
  .rows([share(DiscountField, QuantityField)])
  .columns([AccountManagerField])
  .layers([
    {
      mark: CompositeMarkName,
      encoding: {
        x: AccountManagerField,
        [Y0Encoding]: DiscountField,
        [Y1Encoding]: QuantityField,
        color: RegionField,
      },
      [BarSourceName]: DiscountField,
      [LineSourceName]: QuantityField,
    },
  ])
  .config({
    autoGroupBy: {
      disabled: true,
    },
    axes: {
      y: {
        showAxisLine: true,
      },
    },
  })
  .transform({
    [DiscountField]: (dataset) => {
      return dataset.select({
        field: SidField,
        operator: "eq",
        value: DiscountField,
      });
    },
    [QuantityField]: (dataset) => {
      return dataset.select({
        field: SidField,
        operator: "eq",
        value: QuantityField,
      });
    },
  })
  .data(dm)
  .width(750)
  .height(700)
  .mount("#chart");
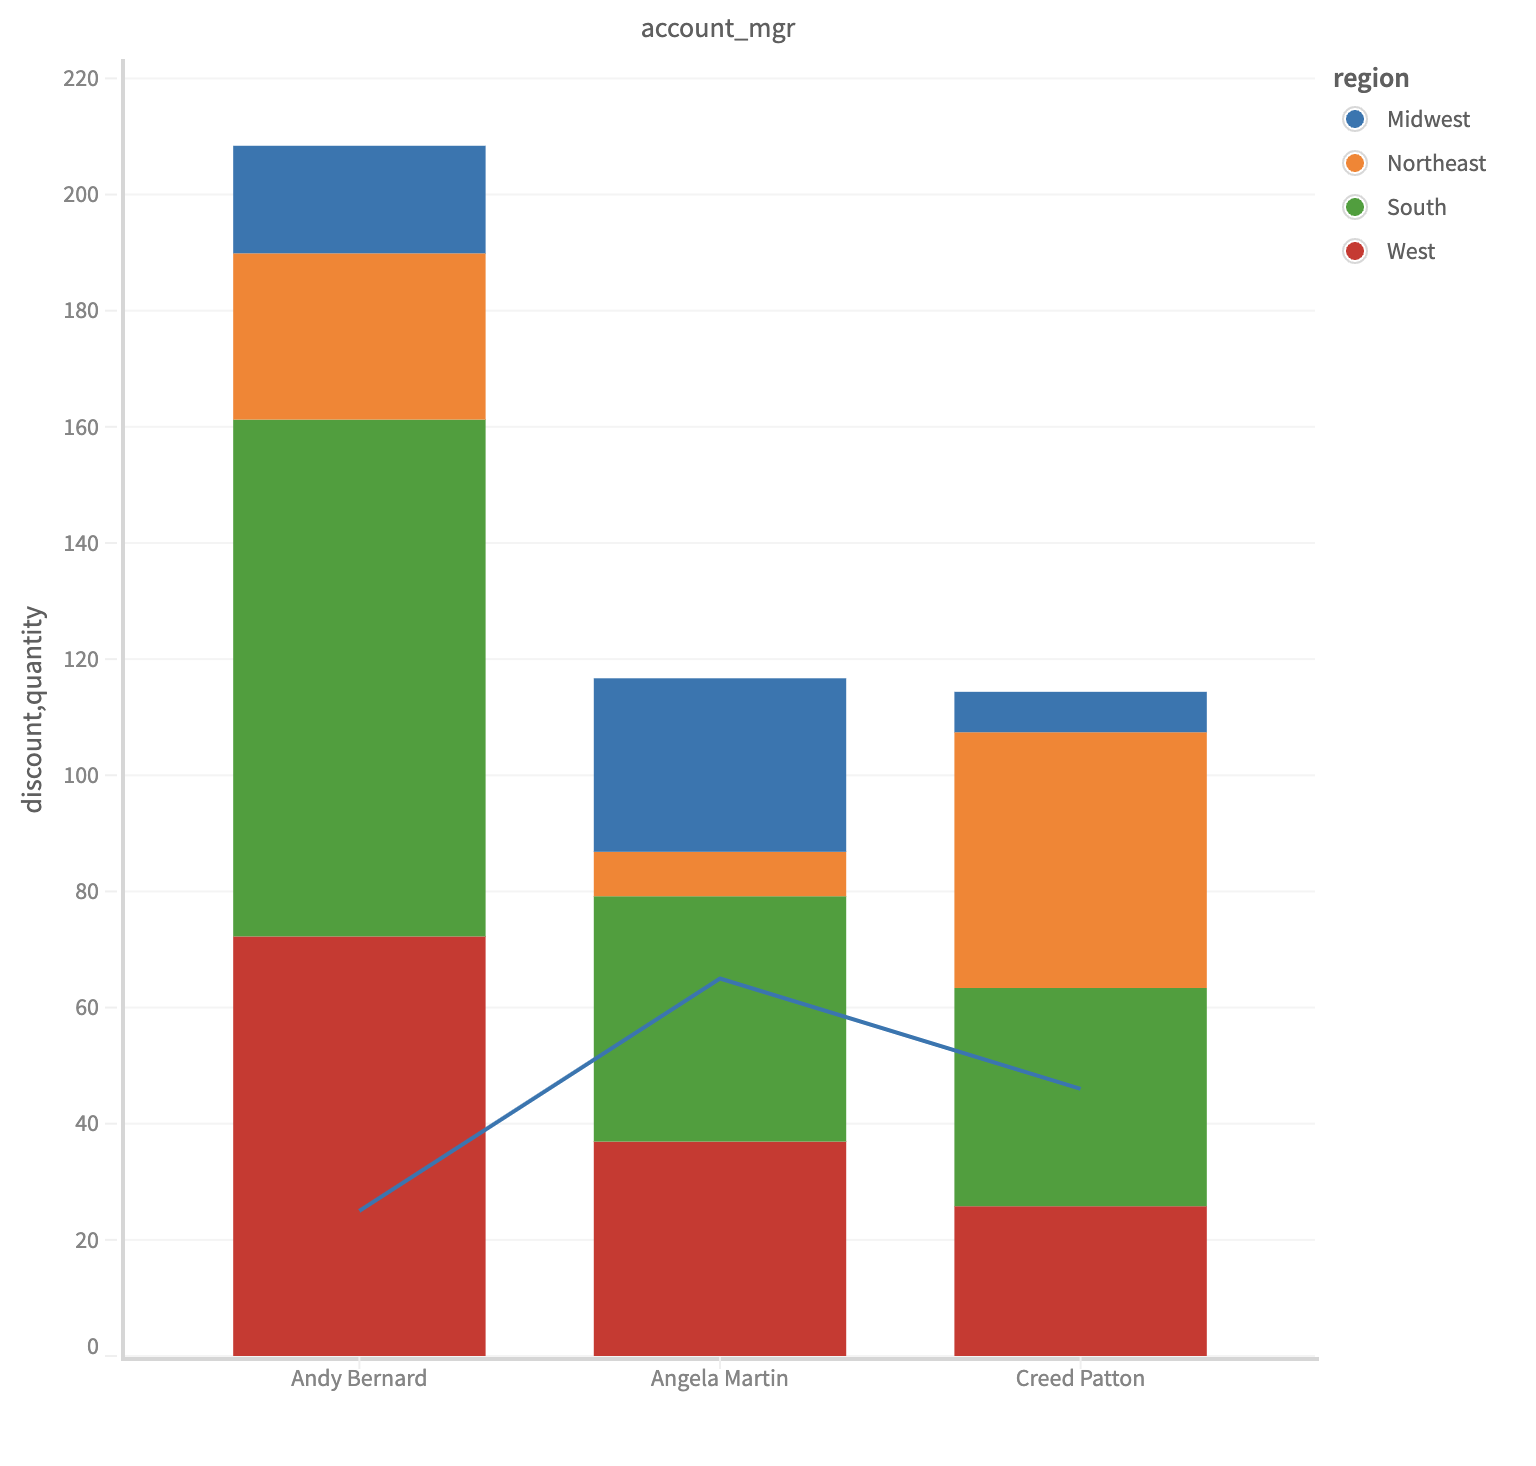
Let us understand the major parts of the sample above:
- composedMark will be the name of the new layer
- we set the y encoding for the bar layer to make vertical bars
- Also we add a color to the bars along with a line layer
- On the layers config, we pass the appropriate fields to the composedMark layer's encoding, which (bar and line) is then rendered on the chart