Rotation
Overview
When a chart has many categories on the band axis, horizontal tick labels can overlap and become unreadable. Muze addresses this by automatically rotating tick labels to either 45° or 90° based on the available space and label dimensions. This is called auto-rotation and activates whenever tick labels are too dense to fit horizontally.
Auto-Rotation (Default Behavior)
The process has two phases:
Phase 1: Per-Axis Angle Selection (Space Computation)
During layout, each x-axis independently evaluates whether 45° or 90° is the better fit.
For each visible tick label, two checks are performed:
- Vertical overflow: Does the label rotated at 45° exceed the available height for ticks?
- Left-edge overflow: Does the label rotated at 45° extend past the left edge of the chart area?
If more than half of the visible ticks would be truncated at 45° and 90° fits within the available height, the axis votes for 90°. Otherwise, it votes for 45°.
Phase 2: Canvas-Wide Consensus (Post-Layout)
After all axes have computed their space, a consensus step ensures every x-axis in the canvas uses the same rotation angle. This prevents visual inconsistency when faceted charts have axes with different label densities.
The consensus uses majority voting:
- Count how many auto-rotated axes voted for 90° vs 45°.
- If more than half voted for 90°, all auto-rotated axes use 90°.
- Otherwise, all use 45°.
Only axes that auto-determined their rotation participate in voting. Axes with an explicit user-configured rotation (see below) are excluded from voting and left unchanged.
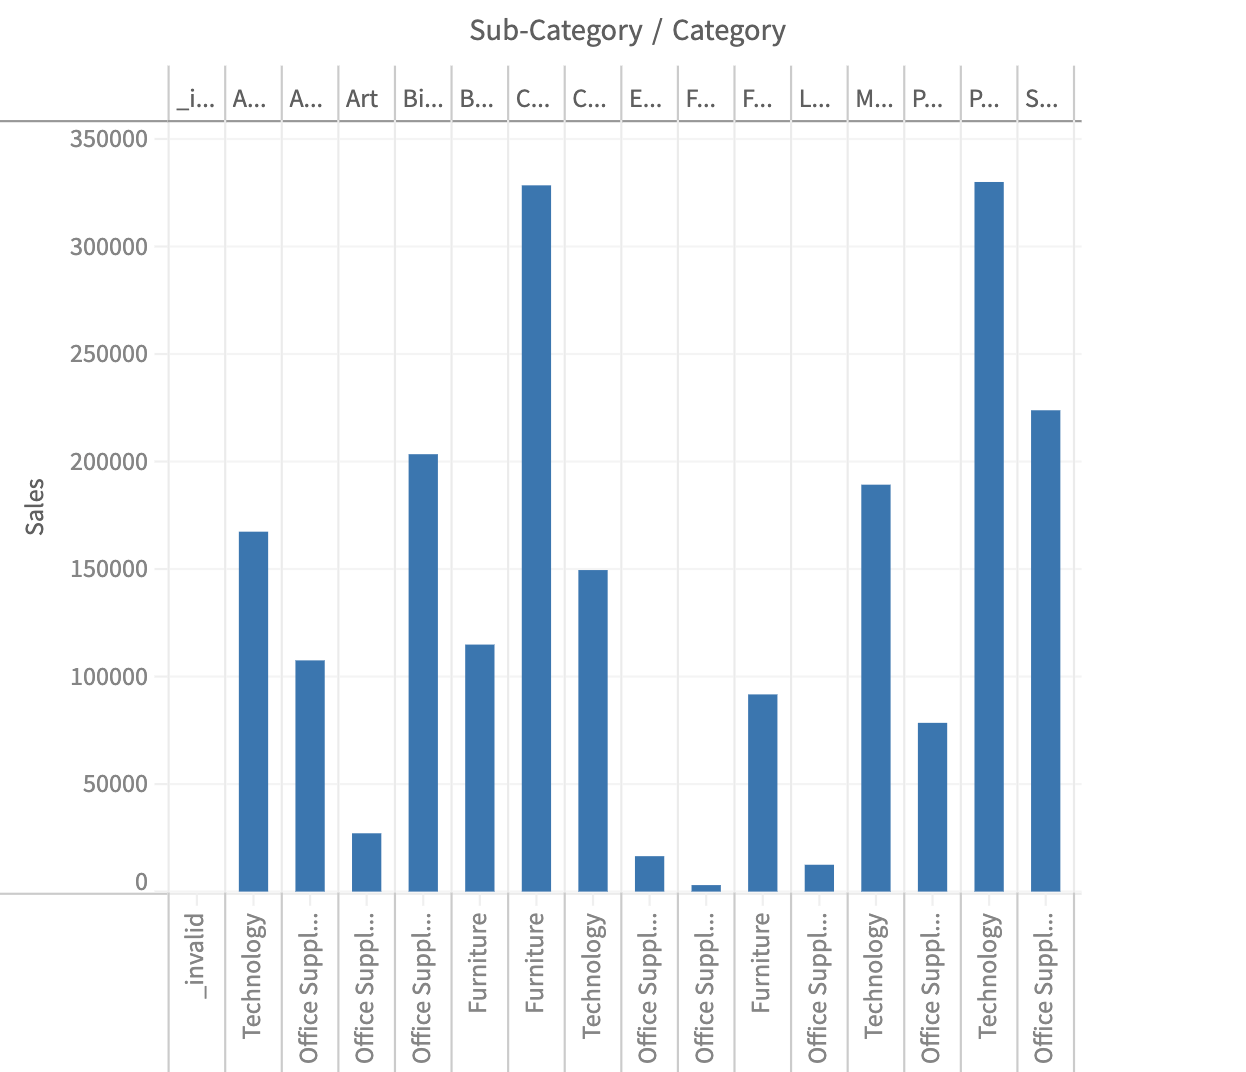
muze
  .canvas()
  .data(data)
  .rows(["Sales"])
  .columns(["Sub-Category", "Category"])
  .config({
    axes: {
      x: {
        compact: true,
      },
    },
  })
  .width(600)
  .height(400)
  .mount("#chart");
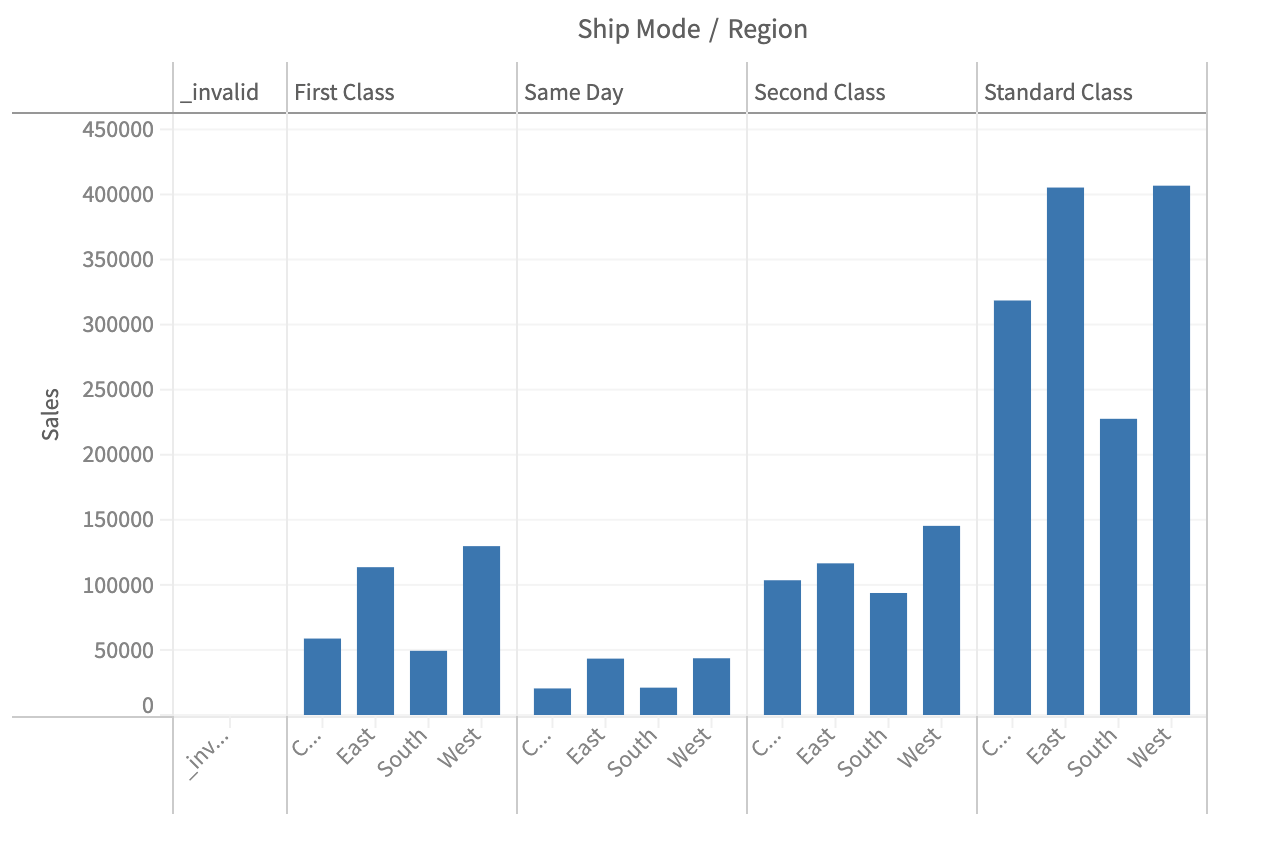
Setting a Custom Rotation Angle
You can set an explicit rotation angle using the labels.rotation property in the axis configuration.
  const { muze, getDataFromSearchQuery, env } = viz;
const data = getDataFromSearchQuery();

muze
  .canvas()
  .data(data)
  .columns(["Ship Mode", "Region"])
  .rows(["Sales"])
  .config({
    axes: {
      x: {
        labels: {
          rotation: 45,
        },
      },
    },
  })
  .width(600)
  .height(400)
  .mount("#chart");